News
Blog | 3 min read
March 3, 2025

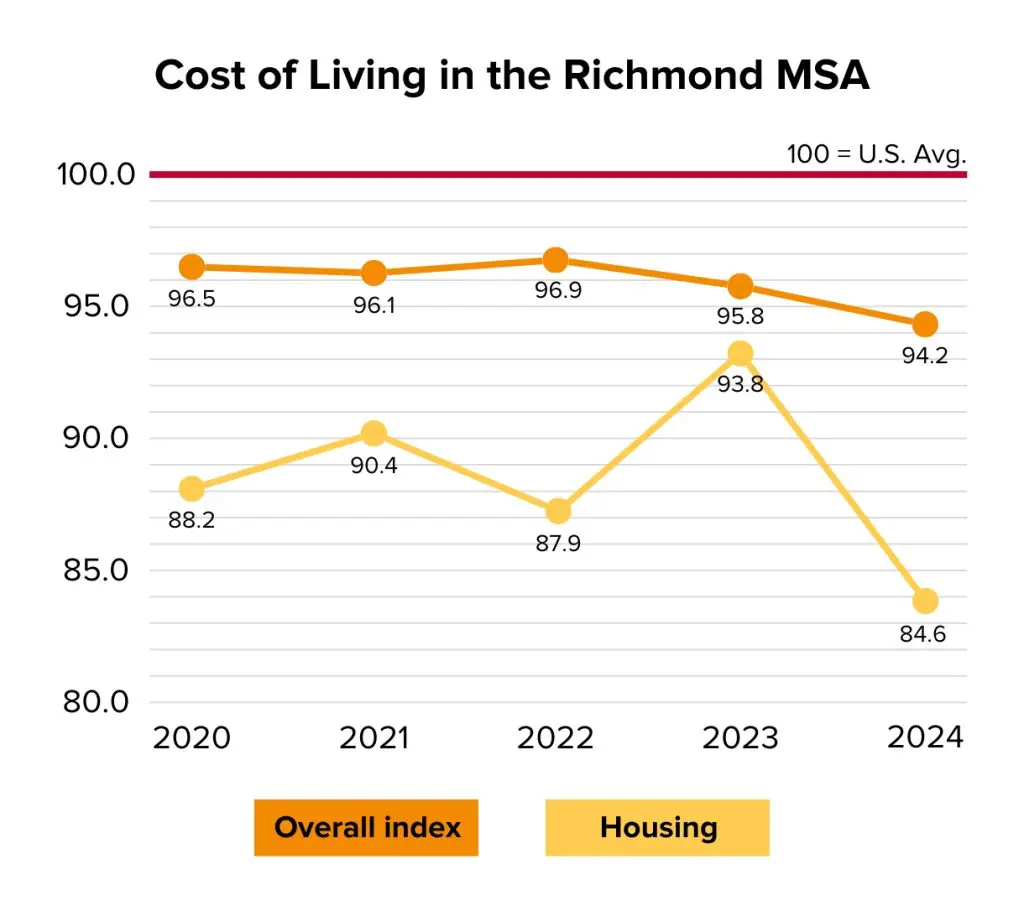
The Council for Community and Economic Research (C2ER), a nationally recognized authority in economic, community and workforce research, finds a slight decrease in the Richmond MSA’s overall cost index compared to 2023. According to the 2024 Annual Average Cost of Living Index, the Richmond MSA’s cost of living dropped nearly two index points from 95.8 in 2023 to 94.2 in 2024. The MSA’s cost of living sits nearly six index points below the national average of 100. The C2ER’s annual Cost of Living study analyzes prices for housing, utilities, transportation, healthcare and groceries as well as miscellaneous goods and services.
The Richmond MSA’s cost of living remains significantly lower than major U.S. cities. With an overall cost index of 94.2 in 2024, Richmond is far more affordable than high-cost metro areas like New York City with an overall index of 161.5, nearly 70 percent more expensive than Richmond, and Los Angeles with an index of 147.2. Cities like Chicago and Philadelphia offer more similarities to Richmond than New York City or Los Angeles, but both cities also exceed the national average with overall cost indexes of 104.3 and 103.1, respectively.
Across the nation and on the East Coast, Richmond maintains its cost savings. For example, a $100,000 salary in the Richmond MSA will stretch 51 percent further in Richmond than in the nation’s capital. Housing costs are 62 percent less in Richmond than in Washington, D.C., and even 8 percent more affordable than a lower cost metro like Raleigh.
| More affordable in Richmond | ||||
| Category | Washington, D.C., MSA | Raleigh, N.C., MSA | Baltimore, Md., MSA | Charlotte, N.C., MSA |
| $100k annual salary | Goes 51% further | Goes 3% further | Goes 7% further | Goes 5% further |
| Groceries | 6% less | 1% less | 3% less | 1% less |
| Housing | 62% less | 8% less | 2% less | Same |
| Average apartment rent | 54% less | 3% less | 13% less | 6% less |
| Average home price | 64% less | 10% less | 7% less | 5% less |
| Utilities | 6% less | 7% more | 13% less | 5% less |
| Transportation | 12% less | 3% more | 9% less | Same |
| Healthcare | 22% less | 19% less | 3% less | 9% less |
This year, all six categories saw a decreasing cost index in the Richmond MSA, meaning prices are rising in Richmond at a slower rate than the national average. Most notably, housing costs decreased by more than 10 percent since 2023 and are now nearly 17 percent more affordable than the national average. While Richmond MSA utilities saw the next largest decrease in cost since 2023, healthcare is the next most affordable category at 9 percent more affordable compared to the U.S. average.
| Category | 2023 Index | 2024 Index | Difference since 2023 (%) | Difference compared to the U.S. average (%) |
| Housing | 93.8 | 84.6 | -10.3% | -16.7% |
| Healthcare | 95.6 | 91.4 | -4.5% | -9% |
| Transportation | 99.7 | 95.1 | -4.7% | -5% |
| Utilities | 104.8 | 96.3 | -8.5% | -3.8% |
| Grocery | 100.5 | 99.8 | -0.7% | -0.2% |
| Misc. goods + services | 100.3 | 99.3 | -1% | -0.7% |
| Overall index | 95.8 | 94.2 | -1.7% | -6% |
Despite nationwide cost of living increases, Greater Richmond remains an affordable location compared to larger and more populated metro areas. Coupled with its high quality of life and abundant economic opportunities, Greater Richmond welcomes new residents and companies.
Find out why more people and businesses are choosing Greater Richmond.